Measurement
Digital Workplace Futures
Before the introduction of collaboration tools, measuring log-ins or user engagement with IT systems was rare. In previous systems of record, usage was considered mandatory for getting the job done. However, in these new systems of engagement, user log-ins, number of comments, number of likes and interactions were of interest in the early days, especially when justifying license costs and investment in training.
These vanity metrics lacked the requisite link to the bottom and top line that would have made them compelling for senior leadership buy-in to occur. In response, we have long championed advancing the conversation around measuring community value, enabling organisations to move quickly through these shifts to identify real business impact.
> Introduction
> Technology
> Ownership
> Community
> Design
> Collaboration
> Skills
> Change Agents
> Leadership
> Org Structure
> Measurement
> Conclusion
- SHIFT 1: Vanity Metrics
- SHIFT 2: Community Metrics
- SHIFT 3: Meaningful Measurements
- NEXT: The Quantified Org
- SHIFT 1: Vanity Metrics
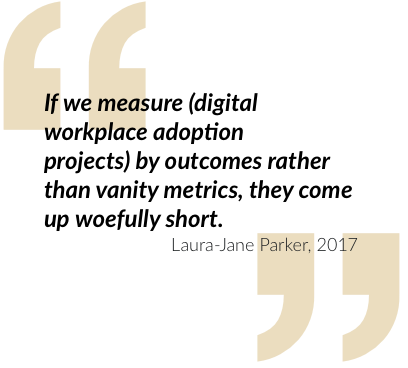
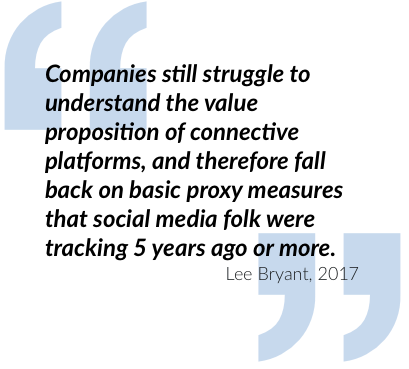
Measuring the success of early roll-outs focused on metrics that made implementation teams and pilot groups feel good, but didn’t tell organisations anything about the value being created. In fact, most analytics dashboards that came as standard contain only these types of measures. These so-called vanity metrics included how many people logged in to the system, how many people joined communities, the number of status updates made and number of documents uploaded.
Since these actions have no impact on business success this meant that after the roll-out phase was complete, these vanity metrics became valueless. Once organisations began to realise this, they were disregarded in favour of using qualitative measures and basic digital maturity models.
Many social business consultancies created maturity models, which combined with the growing realisation that digital change was not going to be a quick fix, allowed organisations to start visualising where they were on the journey of transformation.
- SHIFT 2: Community Metrics
Individual community managers set out to prove the value of their initiatives, and also create more sophisticated models for measuring the impact of their own activities. Supported by specialist organisations, such as the Community Roundtable, they began tracking benchmarking data and performance measures at the community level.
Those best-in-class communities were able to measure the value created for members and also the shared value created for the organisation. They realised that demonstrating the value a community adds to the business in tangible terms, often results in greater stakeholder buy-in and increased resources and budget. This allowed community leaders to become more strategic and drive even greater success.
Strategic community managers created a balanced measurement dashboard, enhanced with stories from the community. This blend of qualitative and quantitative data provided a rounded picture, with the metrics providing the “what” of value created and the stories bringing to life the “how” and “why”.
Although the focus on measuring communities helped prove the business value of the collaboration they enabled, those at the cutting-edge of digital transformation started to look for top-line and bottom-line linkages for longer-term value indications.
- SHIFT 3: Meaningful Measurements
Organisations need to have access to all of the individual data points contained within their digital workplace. This means they can carry out much more detailed, close to real-time measurement of the impact of different ways of working, and therefore make choices between them. By matching markers of collaborative behaviour to teams business results can give deeper insight into the true value-creation potential.
Not only does this approach indicate where and how value is created through collaboration, it also allows organisations to model the attributes that constitute a high-performing team. They get the opportunity to replicate best practices to new teams, thereby propagating transformational practices across the organisation faster.

- NEXT: The Quantified Org
Transformation is a long-term journey, and rarely as straight-forward as it is made to sound! Of course, you cannot achieve it simply as a result of following a 5-year Gantt chart. Instead, it must be continually worked on through small habitual actions in every team, each day. When these small actions are combined, they lead to long-term change. In the 2018-2019 edition of the Altimeter State of Digital Transformation Report, they found that “companies … report digital transformation is still often perceived as a cost center (28%), and data to prove ROI is hard to come by (29%)” and that “the percentage of executives that cited this as their top challenge went up 159% from last year.”.
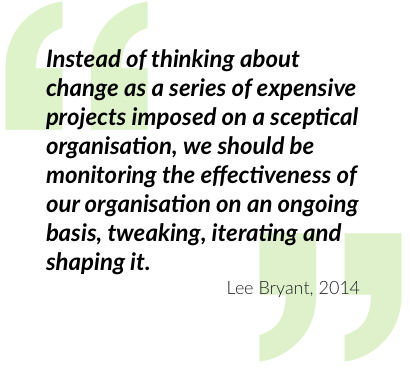
The ability to measure impact of new behaviours by how much value they create is game-changing. When this data is then shared with teams, it allows them to continually tweak, iterate and shape their daily work practices based on solid behaviour data and feedback loops. Inspired by the Quantified Self movement, we call this the Quantified Org.
As the future of work comes closer to reality, it is becoming more complex and detailed. Only those that have developed the ability to adapt quickly based on customer and employee behaviour data will win. New behaviours and habits take time to develop and will only endure if they become part of our everyday running of teams and organisations. Aiming to become a Quantified Org allows change to become routine, and adaptiveness to become part of your DNA.